
In this article, we will look at a highly useful software for data analytics – Power BI. Curious to find out about its efficient features and diverse functions that enable you to get fast and easy transformation of data?
Read on.
Introduction
Tired of working on seemingly infinite rows of data? We know you are looking for an easier way of getting all those reports done, aren’t you?
Power BI is an impressive data visualisation and analytics tool. It aids in converting raw datasets and unprocessed facts or statistics into compelling and visually coherent insights.
Developed by the Microsoft Corporation, Power BI comprises a varied set of services.
Ranging from creating graphs and charts to analysing different datasets and recognizing trends. Power BI can do it all.
It has secured a strong footing in the data analytics industry with its user-friendly interface, an extensive array of features, and robust community support. It has become a go-to for various notable companies including PepsiCo, Roll Royce, and Nestle. Its unique AI abilities, pattern detection, and machine learning integration offer better data modelling, making it a leading name in its market domain.
Transforming Data with Power BI
Data transformation in Power BI refers to cleaning and sorting unprocessed data so that it is suitable for analysis. The software provides different types of data views and a range of functions like rename, merge, filter, etc. which aids in data transformation.
In this article, we shall work on a sample dataset containing details of subscribers for a YouTube channel. We shall edit the data, load it in the software, and perform basic transformations in the Power Query Editor. This tutorial will give you a detailed insight into the basics of Power BI.
Download and Log Into Power BI:
Steps to install Power BI on your system :
- Search for Power BI on your browser and click on its official page.
Alternatively, click download power bi
- Navigate to the “Products” drop-down list and select Power BI → desktop.

- Click on “See download or language options”.

- Select your language of choice and required size → Download.


- Open the downloaded file → agree to all the terms and conditions → install the software.
Steps to Log in to Power BI:
- Click on Sign In → Enter your work email address ie. associated with an organization.

- Fill in your details.
- Get Started!
Transforming the Data in Power BI – Power Query
Here, we shall use a sample dataset containing information about the subscribers of a YouTube channel. Explore how Power BI stands out in data transformation. Curious about comparisons? Dive into Power BI Vs Tableau for a comprehensive data analytics perspective.
- Get Data:This option is available on the ribbon below the “home” tab. From the drop-down list that appears, select the type of your data. If you are unable to find it, click on the “More” option and an extensive list shall appear.


- Loading The Dataset: For this tutorial, we shall choose “Folder”. Now, through the “Browse” option, put in the address of the folder that contains your dataset.

A preview of (the files, if any, within) your dataset will be visible. If you are satisfied with the properties of the preview, you could directly load the dataset into the software. Or else, click on the “edit” option to make the desired changes.

- Changing The File Name: For instance, if you desire to change the name of the file, edit it under
Query Settings → Properties → Name.

- Combining Files: Or, to combine various files within your dataset into a single file, click on the “Combine Files” icon.

Here, both files have been combined into one:

- Replacing Values: Let’s say, we wish to replace one particular value with some other value.
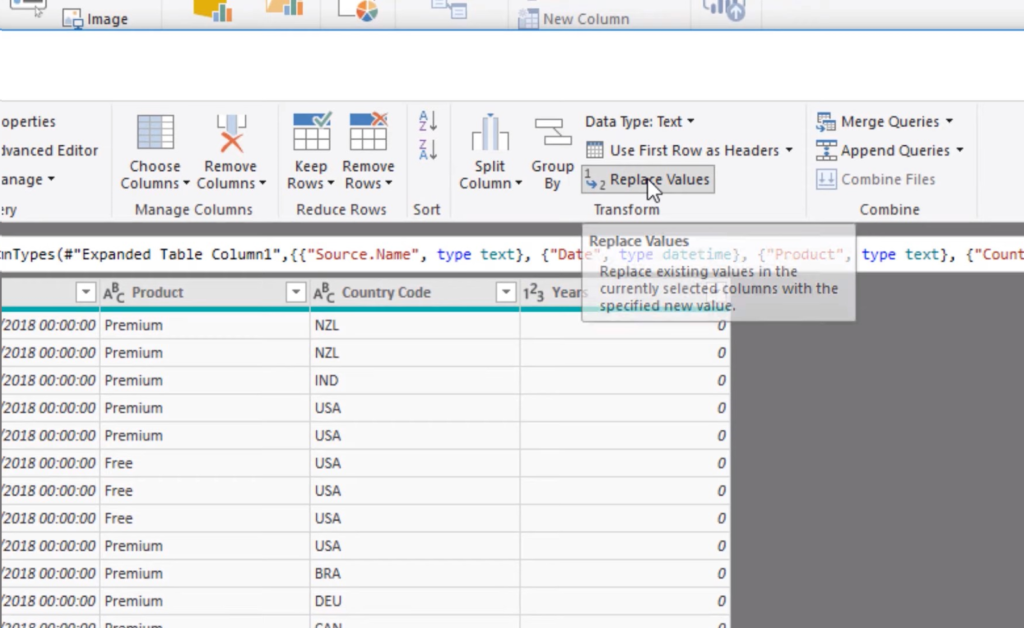
longer contain it. For instance, new.csv becomes new.


Every step and change made to the dataset is accounted for. A record of all applied steps is maintained towards the right side of the screen. The latest step applied appears at the bottom of the list and so on.

- Data Types in Columns: Furthermore, the data type of the data stored in each column is represented in the form of icons towards the left of each column.The columns strictly allow data, only of the assigned type to be stored in it. The type can be changed to any other by simply clicking on the drop-down arrow on the right of each column.

- Fields Section: You can view all the datasets including columns and their types, under the “fields” section.

- Use First Rows As Headers: Another important feature in data transformation is, “use first rows as headers”. Using this, we can push the first row of our dataset as the headers or names of columns. For example, if the first row of your Excel sheet is “name”, for all the names stored in the subsequent rows, then you can push the first row “name” as the column’s header. Now all the names are stored in a “name” column perfectly.

- Capitalization: What if you want to capitalize each word of one particular column?
- Select the desired column
- Navigate to the “Transform” tab.
- Click on the “Format Button”
- Select capitalize each word.

Every change/step is recorded.

- Views in Power BI: There are 3 views in Power BI, ie. Report view, Data view, and Model view. You can access these by clicking on the desired view icon on the leftmost ribbon. Here is an example of our data in the model view in Power BI:

- Working With Large Datasets: Lastly, Power BI allows you to work on extremely large datasets without any hiccups.
For instance, here you can see a total of 942,079 rows in our dataset. Isn’t that impressive?

Conclusion
In a nutshell, Power BI is one of the best tools in the market for efficient data analysis. It provides a seamless approach to cleaning and transforming unprocessed and raw data. Its user-friendly interface and smooth compatibility with other Microsoft products have made it the top choice for hundreds of notable companies. We have also used an elaborate example to explain the basic features of the tool. Right from the selection of the dataset to cleaning, editing, loading, and even presenting the data in multiple views, Power BI is the one-stop solution for presenting insights in a sleek, concise, and engaging manner to the stakeholders.
Frequently Asked Questions
Ans: The “Transform Data” feature of the Power BI software helps in refining unstructured data. The data is cleaned, sorted and presented in various formats like graphs, charts, etc. It allows the user to source data of various types, for example, an Excel sheet, .csv file, PDFs, and many more. The transform feature formats the input data per the personalised commands provided by the user.
Ans: Power BI is a data analytics tool that transforms raw data into an easily understandable format. Companies utilize it to present complex data cleanly. Users select and edit datasets, analyze data, deduce insights, and finally, present visually engaging results for better understanding.
Ans: Yes. Power BI serves as a powerful data transformation tool, simplifying complex organizational data. It seamlessly combines diverse datasets within an enterprise, offering a plethora of features for personalized data. From pivot and unpivot to sorting, filtering, and merging, Power BI employs various techniques to transform and optimize data effectively.
Ans: Power BI utilizes the Power Query Editor for precise data cleaning and restructuring to extract insights from related datasets. The tool allows users to transform data based on their specific requirements. With unparalleled features, Power BI offers an exceptional approach to data analysis and presentation.
Read Some Latest Blogs
- Data Science vs Data Analytics: Top Key Differences for Success

- How To Become A Data Scientist In India?: Achieve Your Data Scientist Dreams

- What are Callback Function in JavaScript?: A Guide to Effective Implementation

- Top 9 Interview Questions and Answers for Freshers Success

- What Is Python and Its Dynamic Uses?
