
Introduction
Picture a forest ranger, surrounded by the lush greenery of a massive woodland, armed not with a traditional map, but equipped with a powerful set of binoculars. His mission? To decode the intricacies of the Power BI vs Tableau forest ecosystem, identify different plant and animal species, and make informed decisions to ensure the well-being of the woodland.
In the vast landscape of information that businesses and analysts navigate today, akin to our forest ranger, there’s a need for clarity and insights. This is where data visualization tools come into play, serving as the modern binoculars for professionals immersed in data.
In the current technical scenario, two standout tools, Power BI and Tableau, emerge as leaders, each with its unique capabilities. In this article, we’ll uncover the significance of these tools, introduce Power BI and Tableau, and emphasize the critical aspect of choosing the right one for the task at hand by performing an extensive comparison to seek out the winner of the Power BI vs Tableau battle.
Power BI Overview
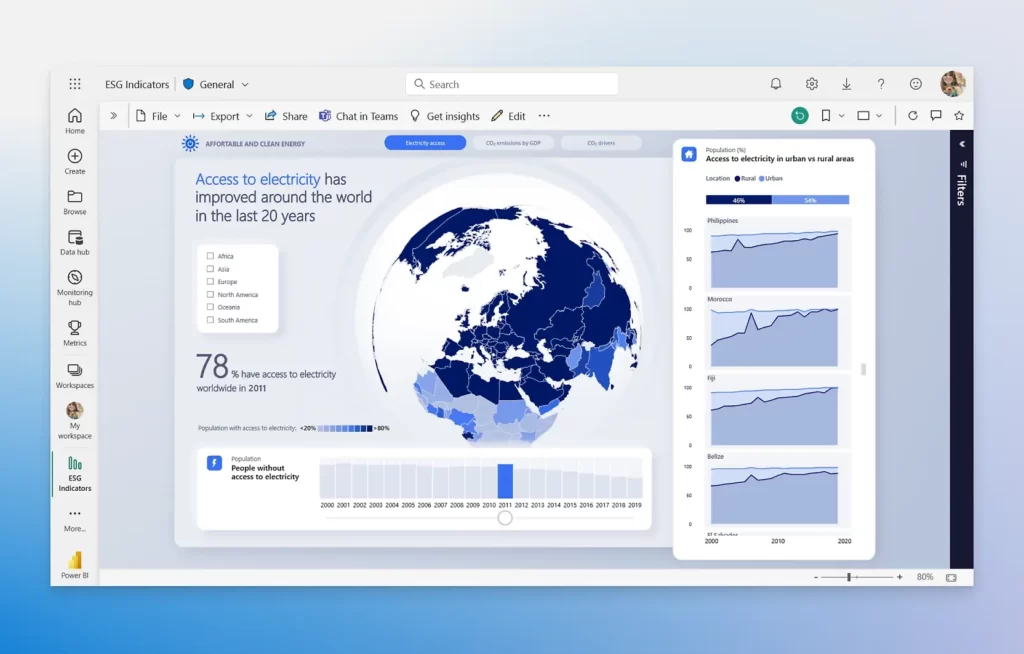
Power BI is a tool offered by Microsoft for data visualisation and analytics. It is supported by Microsoft 365 capabilities offering seamless integration and AI to help enhance the understanding of data generating better insights. Power BI is available as a web application, a mobile application and a desktop application.
Key Features and Capabilities of Power BI
- AI Driven Insights: Imagine our forest ranger was given advanced binoculars that not only identify species but also analyse their behaviours and interactions. With AI-driven insights, these binoculars become supercharged, providing the ranger with a comprehensive understanding of the forest dynamics. They don’t just see a bird; they understand its migration patterns, helping them predict and plan for changes in the ecosystem.
Similarly, while working with data in Power BI, AI tools act as these enhanced binoculars, turning raw data into visuals and empowering users with a deeper understanding of their data.
- Easy and Effective Collection of Data: Our ranger has compiled a meticulous record of every plant and creature in the forest, creating a detailed database in their ranger’s handbook.
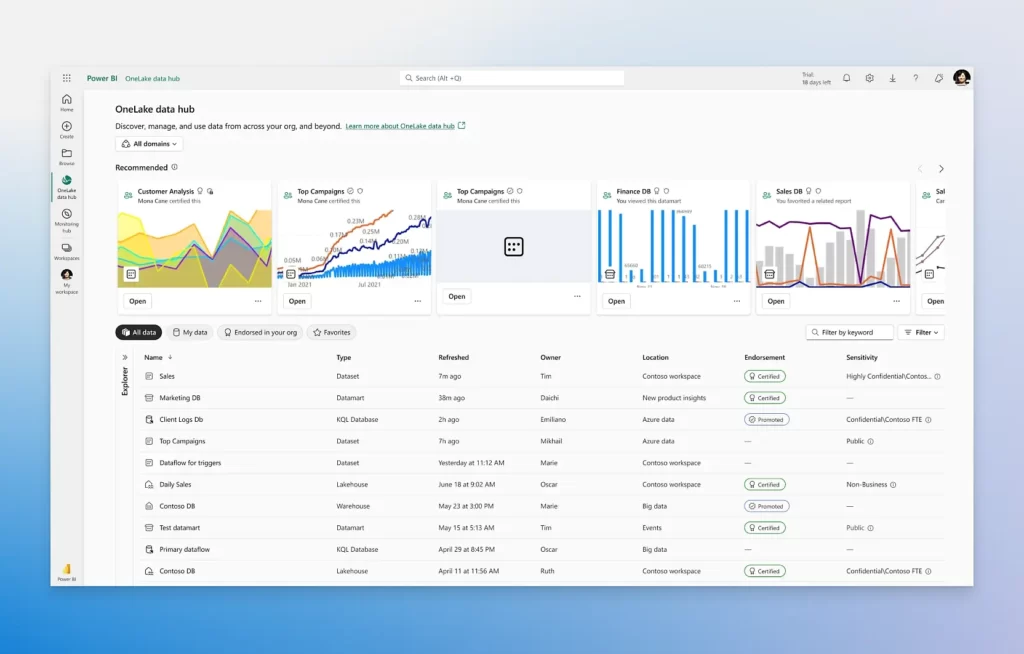
Just like the ranger built a source of truth for the forest’s biodiversity, one can create datasets from any source and add them to a centralised hub, like the OneLake data hub. It’s about having a comprehensive and reliable reference that empowers decision-making based on the most accurate and up-to-date information.
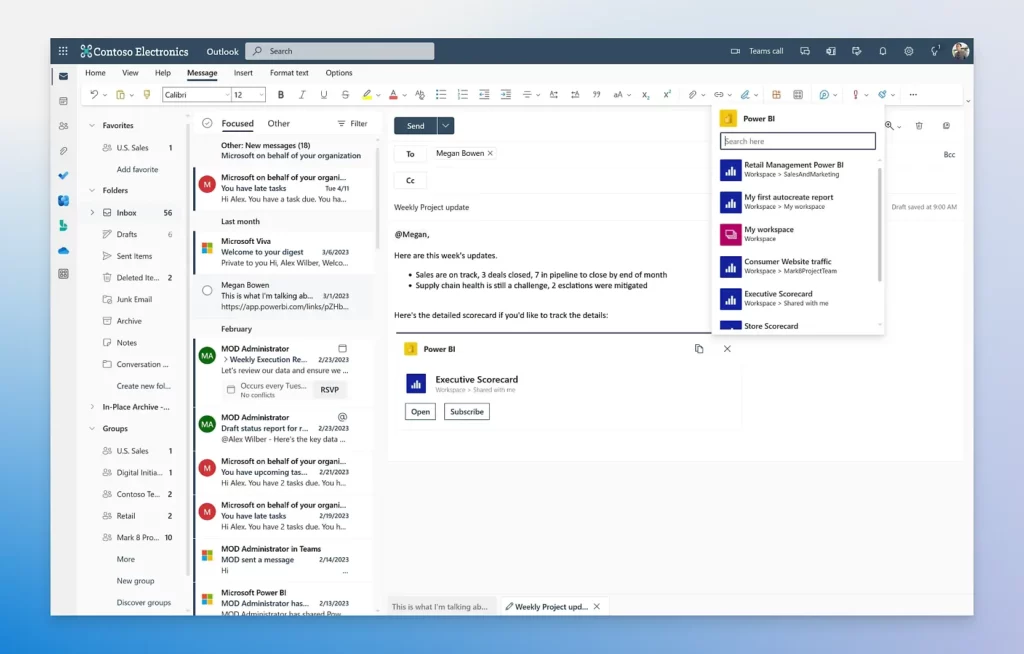
- Generate useful actionable items from insights: A forest ranger’s job is to not only observe the forest but actively uses insights and data to protect it. Consider our ranger using the insights to strategically position wildlife cameras or plan controlled burns to maintain a healthy ecosystem. Tools like Power BI allow users to infuse insights into daily applications, like those in Microsoft 365, enabling informed decision-making at every level of an organisation.
- Easy integration of Microsoft Fabric: If each ranger on the forest team has a set of tools that revolutionises how they access, manage, and act on data, they could get real-time weather updates, track animal movements, or even streamline communication among team members. Similarly, activating Microsoft Fabric in Power BI reshapes how organisations handle data, ensuring that every team member has the tools they need to contribute effectively to the collective understanding and action.
Power BI Desktop Download and Installation Process
You can download Power BI for desktop.
The download process is fairly simple, it is only available for Windows operating systems.
Tableau Overview
Tableau is another data visualisation and analytics software which offers humongous capabilities to understand and visualise data. It supports various data storage services and seamlessly integrates data via their popular and easy-to-use platform. Tableau is now also offering AI capabilities to enhance the workflow of their users.
Key Features and Capabilities of Tableau Server
- Flexible Deployment: Imagine our forest ranger needs to deploy a new observation station deep within the forest. With Tableau, the ranger can configure the station, manage software upgrades, and scale its capacity based on specific needs. Our ranger can now monitor wildlife activity, efficiently managing resources while maintaining compliance with environmental regulations.
- Secure and Confidential Sharing of Data: In the ranger’s daily routine, it’s crucial to have centralised governance over the data they collect. Tableau provides visibility and control over data, ensuring that the forest information is in the right hands. Think of it like cataloguing the various species in the forest With Tableau’s Data Management tools, it’s akin to creating a handbook of authenticated and permission-controlled data sources. Our ranger can then confidently share this data with fellow rangers, ensuring everyone is on the same page when it comes to understanding the forest’s biodiversity.
- Integrate Data Insights, Where You Work: Now, picture our ranger communicating with the team about recent observations on Slack. With Tableau for Slack data can seamlessly integrate data into every conversation making data-driven insights accessible from anywhere in the forest. Additionally, embedded analytics, just like our ranger embedding insights into their observations, allows users to incorporate data-driven insights directly into their products or applications. It’s like turning the ranger’s observations into actionable insights that can be utilized by the entire forest management team.
- Drive Faster, Smarter Decisions: In the heart of the forest, our ranger faces critical decisions daily. With Tableau’s AI capabilities, it’s like having a data-driven advisor by their side. The ranger can save time by generating automated plain-language narratives, turning raw data into understandable stories. When faced with questions about the ecosystem, our ranger can use Ask Data, engaging in a natural language conversation with the data to find answers swiftly. And with Explain Data, it’s like uncovering the “why” behind AI-driven insights, allowing our ranger to delve deeper into the mysteries of the forest. Just as Tableau Blueprint maps the data journey, our ranger can map their observations to create a more informed, data-driven forest management strategy.
Downloading Tableau Public
You can download Tableau Software. It is available both for Windows and Mac operating systems.
Power BI Vs Tableau: A Tabular Comparison
| Factor | Power BI | Tableau |
| Power BI vs Tableau: Drag and Drop Functionality | Available | Available |
| Power BI vs Tableau: Product Line | Power BI DesktopPower BI GatewayPower BI Mobile AppsPower BI Report ServerPower BI Service | Tableau DesktopTableau OnlineTableau PublicTableau ReaderTableau ServerTableau Vizable |
| Power BI vs Tableau: Cost | Professional VersionMonthly: $10 / userAnnually: $100 / userPremium VersionMonthly: $4995 | Pro VersionMonthly: $35 / userAnnually: $1000 / userTableau Creator$70 / month / userTableau Viewer $12 / month / user |
| Power BI vs Tableau: Performance | Better when data size is small and slower when data size is huge. | Perfect and faster for large datasets. |
| Power BI vs Tableau: User Interface | Intuitive. Integrable with Microsoft 365 products. | Intuitive and easy-to-use. |
| Power BI vs Tableau: Supported Data Stores | .xlsx, .csv, folders, SQL databases | .xlsx, .txt, .pdf, .json, cloud databases, SQL databases, GSuite |
| Power BI vs Tableau: Programming Languages | Data Analysis Expression, M Language, R | R, C, C++, Java, Python |
| Power BI vs Tableau: Data Visualisation | Visualisations are detailed and insightful coupled with capabilities to provide further details in question and answer format using Power BI service | Better visualisations and insights |
| Power BI vs Tableau: ML and AI | Uses ML and AI services from Azure and has Copilot as well | Supports ML and has Tableau AI |
Conclusion
In conclusion, Power BI vs Tableau is a long standing debate and the answer to that lies in the specific business needs of a business, the budget and the applications of data visualisation and analytics. If you are going with easy-to-use and a cheaper alternative, Power BI would be a better option. However, if you want advanced visualisations, extensive database support, and flexibility then Tableau would be better suited to your needs. It is advisable to understand both pieces of software and their importance in your organisation after completing a trial period of the same.
FAQs
Ans: If you are working with large volumes of data and complex visualisations, Tableau proves to be better. If you require advanced AI capabilities to interpret your data, Power BI would be a good choice.
Ans: Power BI requires no to low coding skills, users can drag and drop to create their data visualisation and analytics dashboards.
Ans: Python has several packages that enhance its capabilities and offers more data visualisation and analytics capabilities than Power BI however expertise is required to work with Python.
Ans: Certainly, Tableau is a popular data visualisation and analytics software which is processing large volumes of data every day for various big companies.
Read Some Latest Blogs
- Data Science vs Data Analytics: Top Key Differences for Success

- How To Become A Data Scientist In India?: Achieve Your Data Scientist Dreams

- What are Callback Function in JavaScript?: A Guide to Effective Implementation

- Top 9 Interview Questions and Answers for Freshers Success

- What Is Python and Its Dynamic Uses?
